Compass
Compass is dedicated to building easy-to-use NFT analysis tools that help NFT enthusiasts advance to become NFT experts by providing detailed NFT metrics.
Tags:NFT DataCompass Tools

1. Introduction
Compass is dedicated to building easy-to-use NFT analysis tools that help NFT enthusiasts advance to become NFT experts by providing detailed NFT metrics.
2. Core functions
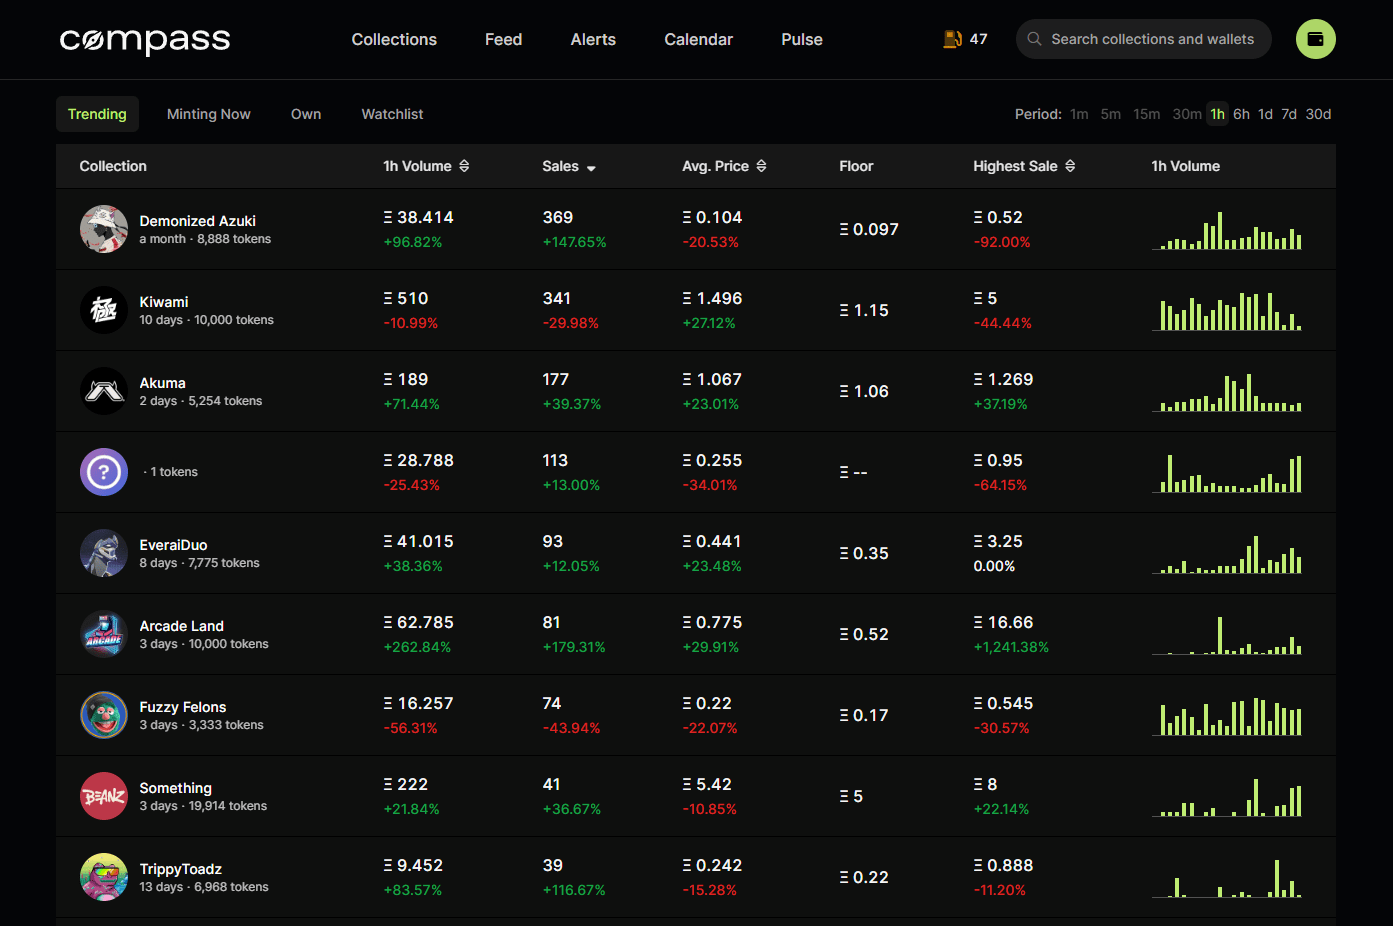
Trending ribbon to track the trend of NFT project transactions on the chain.
The time period for tracking can be chosen from 1/5/15/30 minutes, 1/6 hours, or 1/7/30 days.
The short-period levels 1/5/15/30 minutes require a membership fee to use, or purchase the official NFT for permanent access.
Sorting supports 5 kinds of sorting: transaction amount, transaction volume, average price, floor price and highest price.
The rightmost column shows the volume chart by trading volume.
Minting Now ribbon, you can track the NFT projects that are minting, not yet finished minting.
The time period for tracking can be chosen from 1/5/15/30 minutes, 1/6 hours, or 1/7/30 days.
The short-period levels 1/5/15/30 minutes require a membership fee to use, or purchase the official NFT for permanent access.
Sorting supports 5 kinds of sorting: transaction amount, transaction volume, average price, floor price and highest price.
The rightmost column shows the time of the first mint of the project.

3). Observation Area
Go to the home page of an NFT project and click Watchlist here.
The watch list allows you to track basic trend information for the NFT you are watching.

Upcoming is the NFT project that is about to mint, and Past is the project that has ended mint.

5). Market Trends
- Support for viewing volume data for both Opensea and LooksRare NFT markets
- Support to view the number of NFT projects issued in the market

Relevant Navigation

When browsing Dune Analytics, it is helpful to have a good understanding of query, visualization, and dashboards. These are the basic building blocks and serve as your gateway to the world's blockchain information. As a blockchain analyst, you can create custom queries to obtain data, visualize the results of these queries, and then use dashboards to tell your data story. Behind the scenes, Dune converts difficult-to-access data into human-readable tables. These tables make it possible to write SQL queries and retrieve information from the blockchain. Dune also allows you to access public queries from other users so you can continue their work.