Dune Analytics Tutorial for Beginners
Dune Analytics Tutorial for Beginners
Dune Analytics is a powerful tool for conducting blockchain research. It can be used to query, extract and visualize the vast amount of information available on the ethereum blockchain. This article presents some basic examples that illustrate how to search and write basic queries and how to visualize them using charts. The opportunities to explore are endless.
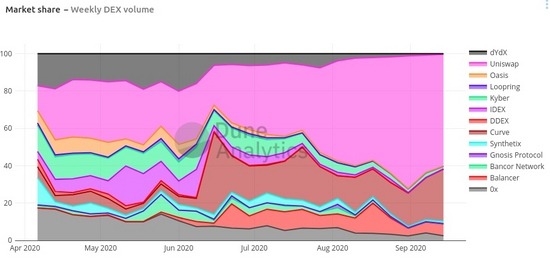
Dex trading volume percentage
In a public blockchain such as Ether, all information is inherently public.All you need is to look for it.Until now, answering questions such as how many users a project has or the daily trading volume of DEX has likely required writing specialized scripting. Executing the script would involve traversing the block, parsing the information, sorting it correctly, and extracting the information. This is both time consuming and very specialized. A script such as this might be able to extract information about a particular project, but it would require a lot of modification to visualize it. In addition, execution on all blocks is a lengthy process in itself, requiring a full node or many individual queries to external services.
Save the day with Dune Analytics
Dune AnalyticsA tool that can greatly simplify this process. It is a web-based platform that allows querying Ether information from a pre-populated library using simple SQL queries. There is no need to write specialized scripting, just query the repository to extract almost all the information residing on the blockchain. This guide covers the basics of how to search, write and visualize basic queries on Dune, so you can start from scratch as a blockchain analyst immediately. Even if you've never worked with SQL before, a few basic examples can help you go a long way.
How Dune Analytics works
At the heart of Dune Analytics is the aggregation of raw information from the blockchain into a SQL library that can be easily queried. For example, there is a table querying all ethereum transactions, nicely divided into columns. The columns cover the transmitter, the receiver, the amount, etc.

Example of querying 5 ethereum transactions
All this information is provided free of charge. The free package (account opening required) includes.
- Search query
- Writing a new query
- Build visualization and dashboards
All free queries are available for all to review and search. Pro accounts also offer additional benefits such as remitting information and removing watermarks from charts.
The information from the blocks is parsed and populated into Dune's database after a delay of a few minutes. In addition to raw blocks and transactions, Dune also has asset price information and specialized tables, such as all addresses of UNI pass holders.
Now, let's get familiar with how to use Dune, now without writing any code, and later look at some SQL basics.
Getting Started with Dune Analytics
After opening an accountHome will look as follows.

Login to the Dune Analytics application
The first screen you see is a list of frequently used dashboards.A dashboard is a collection of queries and charts that other users typically build around specific topics.

ethereum gas price dashboard
There are a large number of dashboards available covering mainstream DeFi projects, DEX transaction volumes, gas usage for ethereum transactions, and more.

You can search for dashboards on a specific project in the search bar on the right. If you can't find a relevant dashboard in the Popular dashboards section, make sure to select "All dashboards" (the search will only look up the selected list).
Each dashboard contains a query. Each chart can be selected, reviewed and edited.
The charts themselves can be easily manipulated from the dashboard review. For example, zoom in, select a part of the chart, etc. Double click on the chart title to select the specific query for which the chart was created.

Here you can choose from Edit Qeuery to review queries or perform smaller operations in-place, or you can select fork to copy the query into your own workspace, and later perform your own operations to store changes and create new charts. We will describe how to edit and build queries in the next section.
Search query
Just like the search dashboard, you can search for queries by selecting the query list from the top bar.

Not all queries are added to the dashboard, so there are many more queries to filter. Successfully finding a query of interest depends, of course, on the author marking it and writing it correctly. Once the query of interest is found, it can be selected, edited or forked, just like any query in the dashboard.
The dashboard is usually part of the query, which the author has chosen to highlight. When searching for information about a specific project, it is best to start with the dashboard, and if you cannot find what you are looking for, continue searching through the list of queries.
What if you can't find what you're looking for? It's time to start experimenting with SQL.
Writing queries
The dashboards and queries of other Dune users are a good starting point when looking up information about a specific project, but sometimes the queries that exist are not enough to answer the question you are working on.
Fortunately, Dune uses the standard PostgreSQL query language. Even if you have never written SQL before, you can use it to easily perform some basic queries.
The first and most useful place to start is with dashboards and queries written by other people. As mentioned before, all public queries can be Forked, or you can simply copy the code from someone else. This is useful for making minor changes to queries that meet most of your needs, or just learning new features and tricks from others. In this short tutorial, start by writing some basic queries, but it's always useful to find relevant inspiration from them.

Create a blank query

New query review section
Some examples of very useful tables.
ethereum .transactions
ethereum .logs
erc20 .ERC20_evt_Transfer
Price.layer1_usd
First query
Every query starts with a research question. The first step is to clearly define what we want to know. As a simple example, let's look at the last 5 transactions.
Naturally, we will find the answer in the table that contains all the Ether transactions, so we first search for that table in the search field. In this case, the search transaction A list of related tables will be displayed, from which we can selectethereum.transactions.
Clicking on a table in the table list will display all the available columns in that table. In this case, we use the ethereum.transactions Table, which is listed ashash, , ,index, , ,gas_priceetc.

Click the double arrow to copy the name into the query field
In this simple example, we choose*This means that from the table ethereum.transactions Select all columns in the
Before executing this query, it is important to note that some queries may take a long time to complete and return too much information. Especially when starting to process a query, it is useful to limit the number of returned entries to speed up processing. This can be done by adding limit clause, which will limit the number of rows returned to the specified number.
From the EtherSelect* . "Trading"Restrictions5
After writing the query, press execute to perform it.

The results of executing a simple query are displayed in the results section
select * from ethereum. "transactions"
  order  by block_time desc  limit  5

As with every job, it is highly recommended to store queries occasionally, especially when working on complex queries (the shortcut Ctrl + S/ Cmd + S will also work).
Simple queries can be found in here Find.
Visualization materials
In addition to simply storing information, Dune Analytics offers a powerful way to visualize it. In this example, let's look at a slightly more complex query. We want to know the total value of ETH transferred per day for the last 10 days. This will also help demonstrate filtering and grouping information by time.
The query to obtain this information is as follows.
Choose from Etherdate_trunc(' day ', block_time)As" Date ".sum ( value / 1e18 )As" Value "
  . "transactions"
  where block_time > now () -interval'10 days '
  group by 1  order by 1
Let's break it down
date_trunc('day', block_time): We don't need to select all the columns in the table, but only the ones we need. In this case, the values of block time and ETH are needed.block_timeis in Unix timestamp format, but we are only interested in getting itsdaypart of interest, so we truncated the rest of the information.as as "Date": Assign aliases to columns. This is not required, but it makes the results easier to read and the charts automatically have better labels.sum(value/1e18): Since we aggregate all the transmitted ETH, we use the SUM function to aggregate the information. Since the precision of ETH is 18 decimal places, we divide the number by 1e18 and get the value in ETH instead of Weiwhere block_time > now() - interval '10 days': Review only the last 10 days of block time. This will also make query execution fastergroup by 1 order by 1: 1 This is the first column we selected (date_trunc). We group the results by date and sort them by date. Since we are grouping the information by day, we need to summarize all the other columns selected. Here we useSUMThe summary function can be used as needed, but can also use MAX, MIN, AVG or any other summary function.

Executing the query will generate similar results. A list of dates and the total amount of Ether transferred on those days.
Now we are going to draw this profile. Select New Visualization to go to the visualization menu.

New visualization button

Dune Analytics Visualization Menu
In this case, we need a graph. We want to plot the sum of the transmitted ETH as a function of the date. Select the X and Y axes accordingly

That's it, we have a basic chart. There are many more possibilities to play with. Chart styles, colors, labels, etc.
Finally, store the charts to add to the query results. Multiple visualizations can be created for each query.
here Examples are available for reference.
Slightly more advanced queries
So far, we have only reviewed queries from a single table. A single table may not have all the information we need. To illustrate this, let's take the previous example, but instead of showing the amount of ETH that has been transferred, we will plot the dollar value amount in ETH.
ethereum.transactionsThe table does not have any price information. Fortunately, Dune provides minute-by-minute price information for a large number of assets.
So we need to join the transaction table and the price table:
Take txs as ( select block_time, value , price
  from ethereum. "transactions" e
  join prices. "layer1_usd" p
  on p.minute = date_trunc(' minute ', e.block_time)
  where block_time > now () - interval ' 10 Heaven'
  and symbol = 'ETH'
)Selectdate_trunc(' day ', block_time)As" Date ".sum ( value * price / 1e18 )As"Value"Fromtxs
 Grouping 1Order1 _  _
Let's break it down line by line.
First, let's create a new auxiliary table with all the information we need. So that the information can be summarized more easily in this new table later.
with txs as: Create a file namedtxsThe new tablefrom ethereum. "transactions" e: Get the information from the table ethereum.transactions and alias the table toejoin prices. "layer1_usd" p: joins the table with the price table and aliases it to p. The join operation will merge the columns of both tableson p.minute = date_trunc('minute', e.block_time): The join operation requires you to specify the column to be joined by on. Here, prices will only be recorded once per minute, so we want to combine the information with the time when the block was created. This will generate an entry for each transaction, but now with additional information from the price table.where block_time > now() - interval '10 days': As before, only the last 10 days of information is availableand symbol = 'ETH': There are many token prices in the price list, we are only interested in the price of ETHselect date_trunc('day', block_time) as "Date", sum(value * price / 1e18) as " Value" from txs: Finally, we perform the same query as before, but multiply the value in ETH by the price. We also multiply the value fromtxsThe information is obtained from the table.
Finally, plotting the information will give the following figure

Query the program code in here
Create Dashboard
Now that we have our charts, we can aggregate them into a dashboard. Click on "Create" -> "New Dashboard" and give your dashboard an informative name

Widgets can be added using the "Add Widget" button in the Dashboard panel or the "Add to Dashboard" button in each visualization in each query.

View specific address
Finally, to demonstrate how to query events associated with a specific address, we will make some modifications to the query to review the amount of ETH transferred to addresses associated with Vitalik Buterin, the co-founder of Ether.
txs is ( select block_time, value , price
  from ethereum. "transactions" e
  join prices. "layer1_usd" p
  on p.minute = date_trunc( 'minute' , e.block_time)
 .( "from" = '\x1Db3439a222C519ab44bb1144fC28167b4Fa6EE6'
     or "from" = '\xAb5801a7D398351b8bE11C439e05C5B3259aeC9B' )
 .p.symbol = 'ETH'
)
Selectdate_trunc( 'month' ,block_time)As "Date" ,Total(Value*Price/ 1e18)As "Value" Fromtxs
  group  by  1  order  by  1
The query is almost identical to the previous one, except that now we have the same query in from A filter has been added to the column. Note the format of the address. When using an address in Dune, it must start with \x and not 0x The beginning, as you will most likely find it in the block browser, is a very common error, so it is important to point this out. The query and its results are in the here can be found.
Limitations of Dune
Although Dune is a super powerful tool, there are still some bugs and limitations worth mentioning. First, currently only events, such as transactions and transfers, can be queried. It is not possible to query the status of the blockchain at a particular block. For example, to find out what the balance of a particular address is in a particular block, you would need to create a query that aggregates all incoming and outgoing transactions for that address. Answering the question "What is the total supply of Ether" is a bit tricky at the moment.
Although the platform can help you get rid of the wrong query most of the time, sometimes queries will hang until they time out. If the query takes an unreasonable amount of time, you may have to try saving it and reloading the page. These errors may be eliminated in the future.
Queries have a limit of 40 minutes until they time out. Querying a large number of profiles and multiple joins can reach the limit. Consider filtering queries (e.g., block time or block number) whenever possible.
Finally, a free user is limited to 3 queries at a time, which may be limiting if a dashboard with multiple charts is to be updated.
Recommended Articles
Contract Check
Enter the contract address and automatically populate all relevant data, including: transaction status, buying and selling fees, liquidity size, lock pool percentage, and whether ownership is relinquished. Code level detection: trade switch, commission, increment switch, blacklist, whether adjustable tax, retrieve ownership switch. Position detection. Simple and convenient!
Black technology tools


Related posts

